
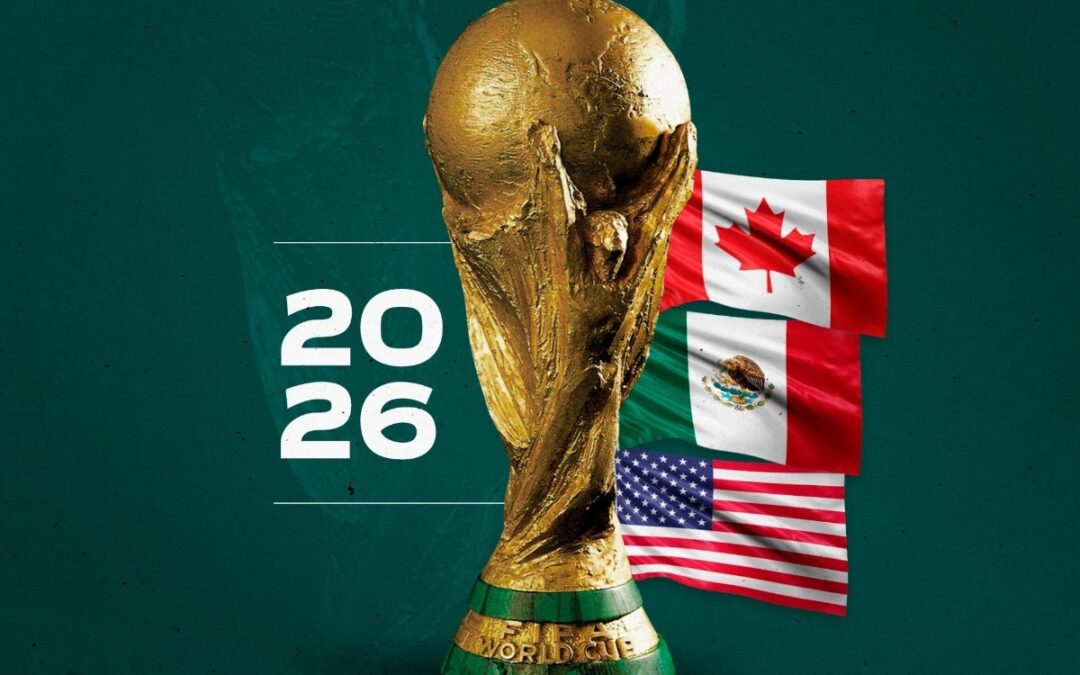
In June 2026, several outlets reported that the World Cup in the United States, Canada and Mexico will generate nearly 70 billion euros in global economic activity.
The figure is striking.
If it were true in net terms, it would mean that hosting a World Cup is one of the most profitable decisions a government can make.
But the historical data tells a different story.
The money map
| World Cup | Host country spending | FIFA revenue (cycle) |
|---|---|---|
| South Africa 2010 | ~$7.2B | $4.19B |
| Brazil 2014 | ~$15B | $5.72B |
| Russia 2018 | ~$11.6B | $6.42B |
| Qatar 2022 | ~$220B | $7.57B |
| USA/CAN/MEX 2026 | ~$3B (est.) | ~$13B (proj.) |
In 2026, for the first time in history, FIFA could earn more than all three host countries spend combined.
FIFA doesn’t invest: it collects
Before analysing host countries, it is worth understanding exactly what FIFA does.
In the South Africa 2010 cycle, FIFA earned $3.66 billion. In Brazil 2014, $4.8 billion. In Russia 2018, $5.36 billion. Qatar 2022 broke all records with $7.57 billion.
The trend is linear. Every four years, more.
For the 2023–2026 cycle, FIFA projects revenues of $13 billion — almost double the previous cycle.
How much does FIFA invest in return? Its operational investment for Qatar 2022 was approximately $1.7 billion, covering marketing, tournament management and broadcasting operations.
In other words: FIFA earned $7.57 billion and invested $1.7 billion. The gross margin was approximately $5.87 billion in a single cycle.
The business is not about organising football. It is about selling the rights to organise it.
South Africa 2010: the first modern test case
South Africa was the first African World Cup and the first in which costs clearly exceeded initial expectations.
The country spent approximately $7.2 billion in total, with over $4 billion directed to infrastructure and stadiums.
The economic results were modest. The tournament added approximately 0.5% to South Africa’s GDP in 2010. Tourist spending recovered just 2.5% of total organisational expenditure.
The infrastructure legacy, presented as the central argument for justifying the investment, came into question when several stadiums fell into disuse after the tournament ended.
Brazil 2014: the stadium car park
Brazil is the case that best illustrates the legacy trap.
World Cup preparations cost between $11 billion and $15 billion, depending on the source.
The most expensive stadium, Mané Garrincha, cost $550 million and hosted only a handful of matches in the months after the tournament. It now serves as a bus park.
Tourism revenue did not compensate either. Tourist income recovered 10% of total organisational expenditure — an improvement on South Africa, but a very marginal return on an investment of that scale.
FIFA, meanwhile, generated nearly $5 billion in revenues during that cycle, approximately half from broadcasting rights, without contributing anything to the costs of running the tournament.
Russia 2018: the most efficient case
Russia is the only recent case in which the numbers approach a reasonable outcome for the host country.
The official cost was $11.6 billion, with more than 70% coming from public funds.
| Item | Russia 2018 |
|---|---|
| Official country cost | $11.6B |
| Public funding share | >70% |
| Tourists during the tournament | 570,000 |
| Direct tourist spending | ~€600M |
| FIFA revenue (cycle) | $6.42B |
Tourism returns were the best of the modern series: 570,000 foreign visitors and an average spend of approximately €1,050 per person.
The ratio between what FIFA earned and what Russia spent was approximately 1 to 1.8. Every dollar FIFA captured cost the Russian state almost two dollars.
Qatar 2022: the case that breaks everything
Qatar is such an extreme case that it should not be used as an analytical benchmark for any other World Cup. But it does serve to lay bare the FIFA model in its most unvarnished form.
Qatar spent approximately $220 billion between 2010 and 2022 on World Cup-related projects, including the Doha Metro, roads, airport expansion and hotels.
FIFA earned $7.57 billion over that cycle and returned approximately $1.7 billion to the host country to cover tournament operations.
| Item | Figure |
|---|---|
| Qatar total spending | ~$220B |
| Of which stadiums + operations | ~$10B |
| Of which national infrastructure | ~$210B |
| FIFA revenue (cycle) | $7.57B |
| FIFA return to host | ~$1.7B |
Qatar’s official argument is that most of the spending would have happened regardless, as part of the Qatar National Vision 2030 development plan. It is a partially valid argument. But it is also an argument that FIFA neither finances nor guarantees.
The cost that never makes the headlines
There is one chapter that systematically stays out of the public debate: tax exemptions.
FIFA requires host candidates to grant full tax exemptions to the organisation, its corporate partners and official sponsors. Germany offered FIFA an estimated $272 million in tax exemptions when it hosted the 2006 World Cup. Brazil and South Africa followed the same model, establishing tax-free zones around tournament venues.
This cost does not appear as “World Cup expenditure”. It does not feature in organisational budgets. But it is public money that the host state forgoes while FIFA and its commercial partners operate on national territory.
Why 2026 is different
The 2026 World Cup changes the equation significantly.
All three countries have existing infrastructure. The 16 selected stadiums are already operational venues that require adaptations, not construction from scratch. The estimated cost is around $2.5–4 billion, a fraction of what Qatar, Brazil or Russia spent.
FIFA, on the other hand, projects revenues of between $11 billion and $13 billion for this cycle, driven by the expansion to 48 teams and 80 matches.
The 1994 precedent is relevant: Los Angeles alone generated $623 million in economic activity, and the group of host cities together exceeded $1 billion.
The problem with the 70 billion figure
The figure of 70 billion euros in global economic activity is exactly the kind of number that sounds solid but is, in practice, the hardest to interpret.
Five specific problems:
Activity is not profit. A tourist who spends €1,000 in a hotel generates economic activity. But if that hotel belongs to an international chain that repatriates its profits, the value retained locally is marginal.
Substitution, not creation. Part of tourist spending would have occurred anyway. The regular visitor who stays away that month because prices have surged is a cost that never gets counted.
Questionable multipliers. Economists such as Andrew Zimbalist have spent years challenging the empirical validity of the multiplier models used in major sporting event impact studies.
Mixed time horizons. The figure blends impacts across different time periods without distinguishing what is immediate, what happens years later, and what never materialises at all.
Who commissions the study. Economic impact studies for World Cups are typically commissioned by the organisers themselves, with obvious incentives to maximise projected figures.
What actually stays in the local economies
| Channel | Certainty | Scale |
|---|---|---|
| Direct tourist spending | High | Medium-low (10–20% of total spend) |
| Temporary employment | High | Real but transitory |
| Media exposure / country brand | Medium | High long-term, not quantifiable |
| Infrastructure with post-event use | Variable | High if well designed; zero if it becomes a car park |
The structural problem is that the highest-return channels are the hardest to measure, and impact studies tend to overestimate precisely the most uncertain ones.
Behind the headline
The news is that the 2026 World Cup will generate tens of billions in global economic activity.
But behind the headline lies a more uncomfortable reading.
Historical data shows that host countries almost never recover in net terms what they invest in organising a World Cup. South Africa recovered 2.5% of its spending through tourism. Brazil recovered 10%. Russia was the most efficient case, and even then spent nearly two dollars for every dollar FIFA earned.
Qatar illustrates the model in its most extreme form: the state builds the stage, assumes the risk, exempts FIFA’s commercial partners from taxes and hands over the infrastructure it has built. FIFA — which invests nothing in stadiums, roads or security — captures contractually guaranteed income before a single ball is kicked.
The popular hypothesis — that states pay for the party while FIFA enjoys the VIP box — is not wrong. But it is incomplete.
The more precise version is this: FIFA has built a model in which states compete for the privilege of financing the event that generates FIFA’s revenues. The spectacle is real. The return for the host is uncertain. The return for FIFA is contractually guaranteed from day one.
In 2026, for the first time, host countries have sufficient existing infrastructure for the event to be genuinely profitable in net terms. The question is not whether there will be economic activity. There will be. The question is whether anyone will run the full numbers when it is all over.