
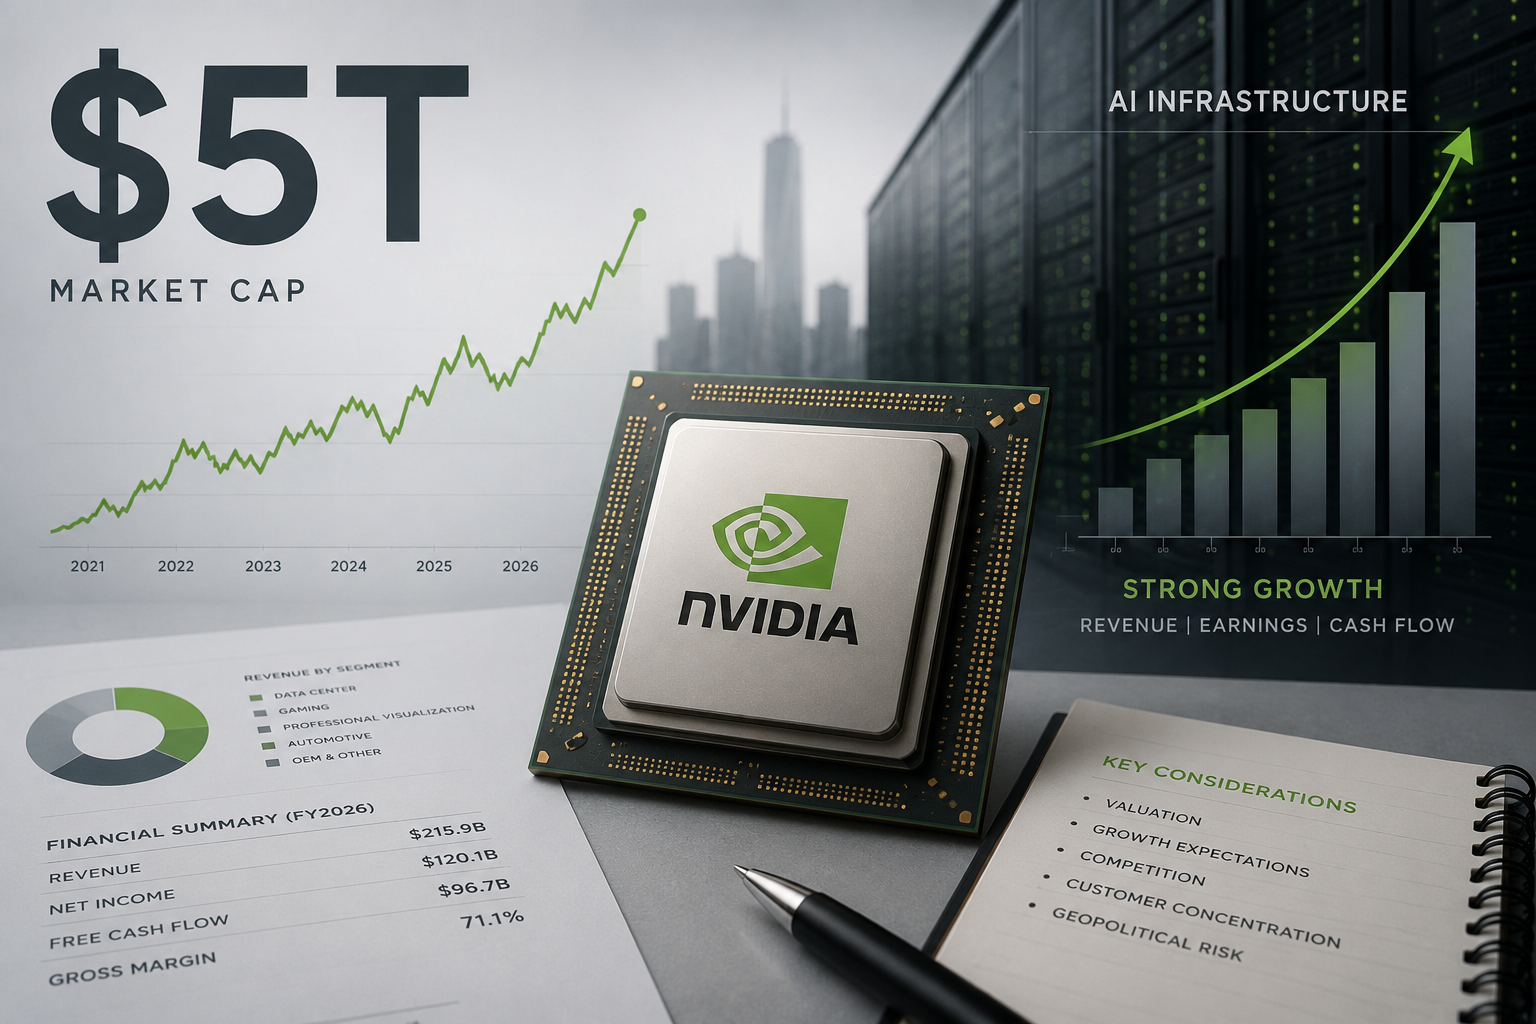
NVIDIA at 5 trillion dollars: is it still cheap?
Goldman Sachs is sticking with its buy rating on NVIDIA, arguing that, despite being worth close to 5 trillion dollars in the stock market, the stock is still cheap. We dig into the company’s real numbers, its margins, its cash position and its risks to work out whether that claim holds up, or whether it depends on assuming the best possible scenario.
In early July 2026, Barron’s published an article covering Goldman Sachs’s latest note on NVIDIA. Analyst James Schneider is keeping his buy rating and his 285-dollar price target, with a specific argument: NVIDIA’s valuation, he says, “is really compelling” given its pace of growth.
The headline that has since spread across dozens of outlets is simple: NVIDIA, the first company in history to come close to a 5 trillion dollar market capitalization, is still cheap.
It’s a claim that sounds almost contradictory. How can the most valuable company that has ever existed be “cheap”?
The short answer is that “cheap” doesn’t mean what it means in everyday language. On the stock market, cheap or expensive doesn’t depend on the size of the number, but on how much you’re paying for each dollar of profit the company generates, or is expected to generate. A 5 trillion dollar company can be cheap, and a 5 billion dollar company can be extremely expensive, depending on that relationship.
The real question, then, isn’t whether 5 trillion dollars is a lot of money. It is; it’s more than the annual GDP of most countries in the world. The question is whether the profit Nvidia generates, and promises to generate, justifies that price.
Answering that requires looking beyond the headline: the numbers, the margins, the cash position, and above all, the assumptions you have to accept as reasonable for the word “cheap” to make sense.
Executive summary
| Metric | FY2024 | FY2025 | FY2026 |
|---|---|---|---|
| Revenue | $60,920M | $130,500M | $215,940M |
| Net income | $29,760M | $72,880M | $120,070M |
| Gross margin | — | 75.0% | 71.1% |
| Net margin | 48.9% | 55.8% | 55.6% |
| Free cash flow | $27,020M | $60,850M | $96,700M |
| Diluted EPS | — | $2.97 | $4.90 |
NVIDIA’s fiscal years, ending in late January. Source: FY2026 10-K and earnings releases (SEC).
NVIDIA has no solvency problem whatsoever: it generates far more cash than it needs, carries almost no debt, and its margins, while they have dipped slightly, remain extraordinary by any industry standard.
The problem isn’t on the balance sheet. It’s in what you have to assume about the future for the current price to make sense: that global spending on AI infrastructure roughly doubles between now and 2027, and that NVIDIA doesn’t lose meaningful market share to competition that is becoming more real by the quarter.
The number that scares people: 5 trillion dollars
NVIDIA first crossed 5 trillion dollars in market capitalization in October 2025, came close to that figure again in May 2026 (briefly surpassing it, according to some sources), and by early July 2026 trades around 4.7-4.8 trillion, after a correction of roughly 15-17% from its all-time high of $236.54 per share.
For that number to make sense, it’s worth explaining what market capitalization actually is: a stock’s price multiplied by the total number of shares outstanding. It is not “the cash the company has,” nor “what it would cost to buy the whole company” (buying it outright would cost more, because of the control premium), nor a direct measure of profit. It is simply how much investors, collectively, are willing to pay to own the entire business at a given moment.
With about 24.2 billion shares outstanding, NVIDIA needs to trade around $206 per share to cross the 5 trillion threshold again. From the $195-198 it was trading at in early July, that’s a rise of barely 5-6%.
Put another way: the round number of 5 trillion is, above all, a psychological and journalistic milestone. What matters isn’t whether the stock sits on one side of that line or the other, but how much future profit the market is paying for upfront when it buys the stock at that price. And that’s where Goldman’s claim comes in.
What Goldman Sachs actually says
Before getting into the numbers, it’s worth being precise about what Goldman’s note actually argues, because much of the media coverage simplifies it to the point of distortion.
Schneider’s argument rests on three legs:
First, the multiple. NVIDIA would trade at less than 14 times Goldman’s own earnings estimate for fiscal year 2027. That’s a low figure for a company that, by Goldman’s own estimate, will grow revenue 55% next year, to $635 billion.
Second, the historical comparison. NVIDIA’s current multiple on future earnings (between 19.8 and 21.7 times, depending on whether you use market consensus or Goldman’s own note) is well below the company’s own five-year average, which sits around 72 times.
Third, the sector context. Goldman argues that this multiple doesn’t yet reflect the boost that will come from the major cloud providers’ (Microsoft, Google, Amazon, Meta) AI infrastructure spending, which would go from roughly $650 billion in 2026 to over $1 trillion in 2027.
There’s an important nuance that almost no outlet picks up on: the “less than 14 times” figure doesn’t use analyst consensus, it uses Goldman’s own estimate, which is more optimistic than the market consensus. If you use Wall Street’s general consensus instead of that estimate, the multiple rises to 19.8-21.7 times. Still relatively low, but no longer as striking as “less than 14 times.”
This doesn’t invalidate Goldman’s argument. But it means part of the “it’s cheap” conclusion depends on accepting, upfront, the growth forecast of the very firm making the buy recommendation. It’s a partly circular argument: NVIDIA is cheap if Goldman’s scenario plays out, and Goldman’s scenario is precisely what makes NVIDIA look cheap.
It’s also worth noting that Goldman’s price target, $285, sits below the average of the other analysts covering the stock, which is around $300-310. Goldman isn’t the most bullish house on NVIDIA; if anything, it’s moderately more cautious than the consensus.
The numbers: real growth, margins under pressure
Before debating whether the price is right, it’s worth understanding the business.
Revenue: extraordinary growth, but mathematically unsustainable at the same pace
| Fiscal year | Revenue | Year-over-year change |
|---|---|---|
| FY2023 | $26,970M | — |
| FY2024 | $60,920M | +125.9% |
| FY2025 | $130,500M | +114.2% |
| FY2026 | $215,940M | +65.5% |
| Trailing 12 months (April 2026) | $253,490M | — |
Source: FY2026 10-K (SEC), NVIDIA earnings releases.
The most recent reported quarter (ended April 26, 2026) shows revenue of $81.6 billion, up 85% year over year, with the datacenter business (the part that sells GPUs for training and running inference on AI models) growing 92%, to $75.2 billion.
The percentage slowdown (from +126% to +65%) isn’t a bad sign in itself; it’s pure arithmetic. It’s impossible to sustain 100% growth indefinitely on a base that already exceeds $200 billion. What matters is that, in absolute dollar terms, every quarter is still a record.
Margins: the part that gets the least coverage
| Metric | FY2025 | FY2026 | Trailing 12 months |
|---|---|---|---|
| Gross margin | 75.0% | 71.1% | 74.15% |
| Operating margin | 62.4% | 60.4% | ~64% |
| Net margin | 55.8% | 55.6% | 62.97% |
Source: FY2026 10-K (SEC).
Gross margin, the percentage of every sales dollar left after direct chip production costs, fell from 75% to 71.1% in the last full fiscal year. NVIDIA itself explains in its 10-K that part of that decline comes from charges tied to export restrictions to China (the H20 chip, designed specifically to comply with those restrictions, generated a $4.5 billion charge in a single quarter) and from inventory provision adjustments.
It’s a moderate decline, not an alarming one, and the most recent trailing-twelve-month data shows some recovery toward 74%. But it’s worth keeping in mind: NVIDIA’s gross margin isn’t a straight upward line, and it has already shown it can move several percentage points based on regulatory decisions the company doesn’t control.
Cash and balance sheet: no real debate here
- Cash, equivalents and marketable securities: $62.6 billion at FY2026 close.
- Long-term debt: about $7.5 billion. Practically irrelevant relative to available cash.
- Current ratio: 3.44 times (for every dollar of short-term debt, NVIDIA has $3.44 in liquid assets).
- FY2026 free cash flow: $96.7 billion, almost 45% of total revenue.
In FY2026, NVIDIA returned $41.1 billion to shareholders through buybacks and dividends, bought startup Groq for $13 billion, and still finished the year with more cash than debt. On solvency grounds, there’s no serious argument against NVIDIA. That’s not where the debate lies.
The multiples, explained
This is the part where non-specialist readers usually get lost, so it deserves an explanatory pause before comparing figures.
P/E (Price to Earnings Ratio): how many times current annual profit is contained in the stock price. A P/E of 30 means that, at the current profit rate, it would take 30 years to “recoup” the price paid purely through profits (obviously nobody buys a stock for that reason; the P/E is a way of comparing prices across different companies, adjusted for the size of their profit).
Forward P/E: the same thing, but using the profit the company is expected to earn over the next twelve months instead of profit already generated. It’s more relevant for fast-growing companies, because the trailing P/E can look high simply because tomorrow’s profit will be much larger than yesterday’s.
PEG ratio: the forward P/E divided by the expected earnings growth rate. A PEG of 1 is usually read as “fair price” relative to growth; below 1, potentially cheap; above, potentially expensive. It’s a rule of thumb, not an exact formula.
EV/EBITDA: enterprise value (market cap plus debt, minus cash) divided by operating profit before interest, taxes, depreciation and amortization. Used to compare companies with different debt structures or tax situations.
Price/Sales: market capitalization divided by revenue. Useful for companies where profit is still volatile or irrelevant; less useful for a company like NVIDIA, which already has massive, stable profits.
With that out of the way, here’s where NVIDIA stands in early July 2026:
| Multiple | NVIDIA |
|---|---|
| P/E (trailing 12 months) | ~30x |
| Forward P/E (market consensus) | ~19.8-21.7x |
| Forward P/E (Goldman’s own estimate) | <14x |
| PEG ratio | 0.44 |
| EV/EBITDA | ~28.6x |
| Price/Sales | ~18.7x |
Source: stockanalysis.com; Price/Sales calculated independently.
A PEG of 0.44 is, indeed, a figure normally associated with a stock undervalued relative to its expected growth. It’s the single data point most favorable to Goldman’s thesis.
Is NVIDIA expensive or cheap next to its peers?
| Company | Approx. market cap | Approx. forward P/E |
|---|---|---|
| NVIDIA | $4.7-4.8 trillion | 19.8-21.7x (consensus) / <14x (Goldman) |
| Apple | $4.3 trillion | ~31x |
| Alphabet | $4.2-4.3 trillion | ~19-21.6x |
| Microsoft | $2.8-3.2 trillion | ~30-33x |
| Amazon | $2.6-2.8 trillion | ~30-40x |
| Meta | $1.6-1.7 trillion | ~19.8-22x |
| Broadcom | $1.8 trillion | ~19.8-22.9x |
Source: The Motley Fool, Alpha-Sense, stockanalysis.com, GuruFocus, Investing.com (various dates, July 2026).
Using the consensus forward P/E, NVIDIA trades in line with Alphabet, Meta and Broadcom, and well below Microsoft, Amazon and especially Apple. This is, literally, the argument circulating in several financial outlets: “NVIDIA has the lowest valuation of the five biggest companies in the world.”
That’s a true statement. But it deserves an important caveat: Apple, Microsoft, Alphabet, Amazon and Meta all have diversified businesses, with recurring revenue and multiple sources of demand (advertising, subscriptions, enterprise software, e-commerce). NVIDIA, by contrast, depends on a small number of customers, the same hyperscalers in the table above, who are also actively investing in developing their own chips to depend less on NVIDIA in the future.
Comparing NVIDIA’s multiple to Apple’s without adjusting for that difference in risk is, probably, the single most common, and most misleading, simplification in all the media coverage of this story.
What has to happen for the current price to make sense
For NVIDIA’s current valuation to hold up without surprises, more or less all of the following conditions have to occur at once:
- Hyperscaler spending on AI infrastructure must accelerate, from roughly $650 billion in 2026 to over $1 trillion in 2027, without slowing down due to a lack of demonstrated return on that investment.
- NVIDIA must keep dominating the GPU market despite the advance of its own customers’ in-house chips (Google’s TPU, Amazon’s Trainium) and suppliers like Broadcom, which already reports 100-200% year-over-year growth in AI chip revenue each quarter.
- The next chip generation (Vera Rubin) must arrive without significant delays. There’s already a warning sign here: a circuit board issue has pushed the system succeeding Vera Rubin back to 2028, according to several financial outlets in early July 2026.
- Margins must stay high, despite growing competition and the fact that NVIDIA’s own customers, who buy tens of billions of dollars in chips, have increasing negotiating leverage.
- China would ideally need to become a real market again. Right now it isn’t: even though the United States has approved the sale of certain chips (H200) to Chinese companies, authorities in Beijing are steering their tech companies toward domestic suppliers, and as of mid-May 2026 not a single H200 chip had been sold in China despite the approval. That market once contributed between $12 and $15 billion a year to NVIDIA.
None of these five conditions is unreasonable on its own. The problem is that the current valuation, at bottom, requires all five to hold simultaneously and without significant friction for at least two years.
What’s really behind the headline
The news is that Goldman Sachs is sticking with its buy rating on NVIDIA, arguing the stock is still cheap despite nearing 5 trillion dollars in market value.
And in a strictly mathematical sense, Goldman is right: under its own growth assumptions, the multiple being paid for NVIDIA today is genuinely low, both against the company’s own history and against most of its tech peers.
But that claim hides a subtle trap, the same trap running through much of the 2026 debate about Big Tech: a low multiple on future earnings is only a bargain if that future earnings figure actually shows up. And the future earnings figure that makes NVIDIA look cheap isn’t a conservative scenario. It’s a scenario in which global spending on AI infrastructure roughly doubles in a single year, and in which NVIDIA doesn’t cede meaningful ground to competition that is getting more real by the month.
NVIDIA has no balance-sheet problem: it generates cash like few companies in history, carries almost no debt, and its margins, though they’ve softened a little, remain extraordinary. That isn’t where the debate is.
The real debate is whether it’s worth paying today a price that only makes sense if the AI investment cycle holds up, without cracks, for the next two years; if competition from its customers’ own chips doesn’t advance faster than expected; and if China stays, as it has so far, a closed market that doesn’t count for better or worse in the numbers.
Goldman’s claim being reasonable doesn’t make it conservative. And the fact that it sounds counterintuitive, “the biggest company in history is still cheap”, doesn’t automatically make it false. Above all, it’s a very specific bet on how fast, and how cleanly, the AI business keeps growing. The size of the number, 5 trillion dollars, says nothing on its own. What’s behind that number does.